

In November, Treasury rates dropped, and risk assets rallied. The market expects continuing drops in inflation and slower, but not disastrous, growth. The data support the market's sanguine assessment.
November of 2023 saw a massive rally in risk assets and a large drop in Treasury yields.
.png)
This rally in risk assets and Treasury bonds can be traced to two sets of macro announcements. In early November, there was a weak ADP employment report, which was followed by higher-than-expected jobless claims, weaker-than-expected non-farm payrolls, and a higher-than-expected unemployment rate. November 14th brought benign inflation numbers, with core and ex-food-and-energy CPI all coming in lower than expected.
As of mid-November, Fed funds futures were predicting that the Fed will start cutting rates in mid-2024, which is several months earlier than the forecast from before the CPI numbers came out. The market's bullish reaction to the weaker jobs and better inflation data is predicated on a dual thesis: Fed policy will orchestrate lower rates and slower growth, while avoiding a moderate to severe recession. It's a fine line for the Fed to walk, but the macro tea leaves are lined up just right.
Inflation
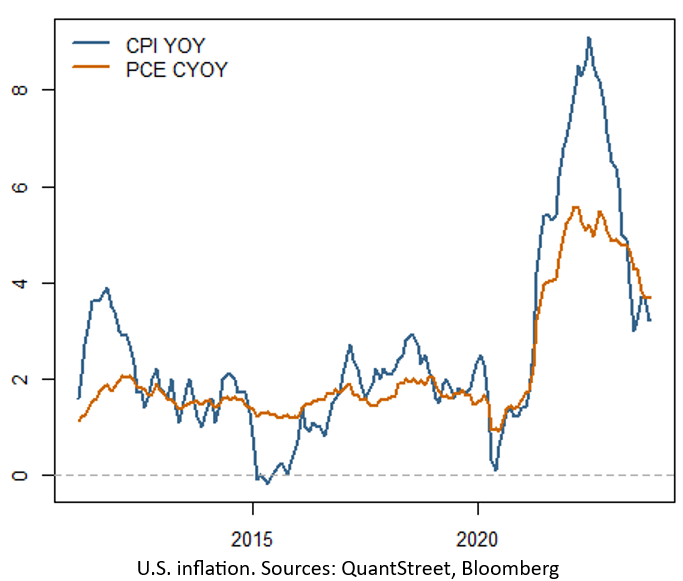
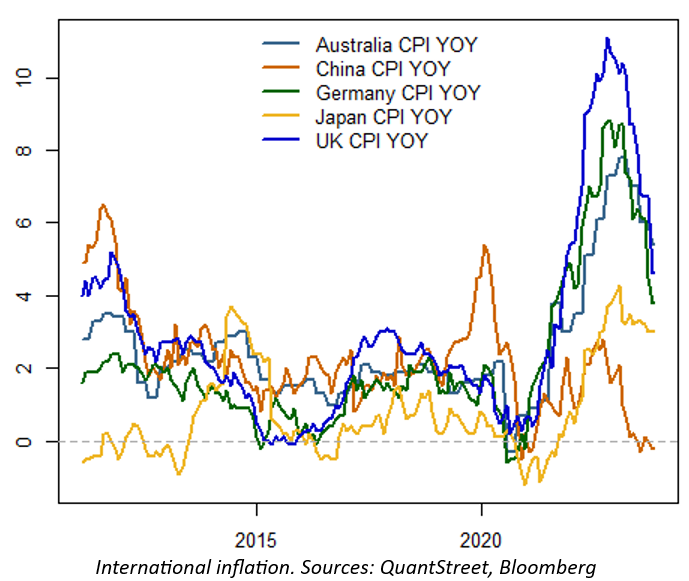
The better inflation numbers in the U.S. are consistent with numbers globally. After peaking in 2022, year-over-year CPI inflation is heading lower seemingly everywhere, not only in the U.S. Any idiosyncrasies of U.S. inflation data – and there are surely many – cannot account for the global drop in inflation, with China entering deflationary territory.
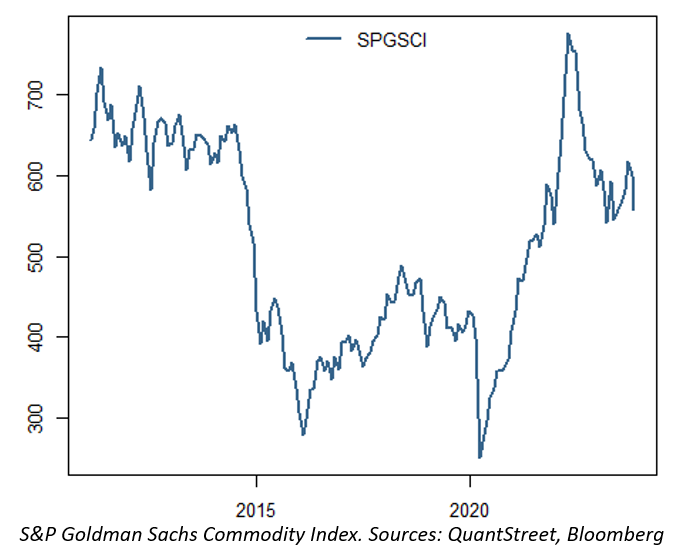
Commodity prices, another major contributor to the 2022 inflationary spike, have moderated. The S&P Goldman Sachs Commodity Index is well off its 2022 highs, and despite concerns after the October 7 Hamas terror attack in Israel, a wider war in the Middle East has not materialized. This remains a risk, but for the time being commodity prices are not contributing to inflationary pressures.
The inflation hawks, while acknowledging these points, nevertheless argue that economic growth remains robust, and inflationary pressures will inevitably rise, dragging rates up and pushing risk asset prices down. But an objective look at the macroeconomic data does not support this argument.
Consumers, housing, and growth
The University of Michigan Consumer Survey is one of the most important gauges of U.S. economic sentiment. After experiencing a sharp fall in 2020 during the onset of the COVID pandemic, consumer sentiment tried to bounce several times, only to experience subsequent drops, the most recent one having started in September of 2023. Remarkably, consumer sentiment is now near its lows over the last 50 years.
.png)
One of the notable features of the latest Michigan consumer survey is the large percentage of participants who mention tight credit conditions for home purchases as one of the important determinants of their economic view. Consistent with this message, the housing affordability index put out by the National Association of Realtors is pointing to the lowest level of affordability since the survey began in the mid-80s. Apparently mortgage rates in the 8% range are, indeed, having a contractionary effect on the U.S. economy.
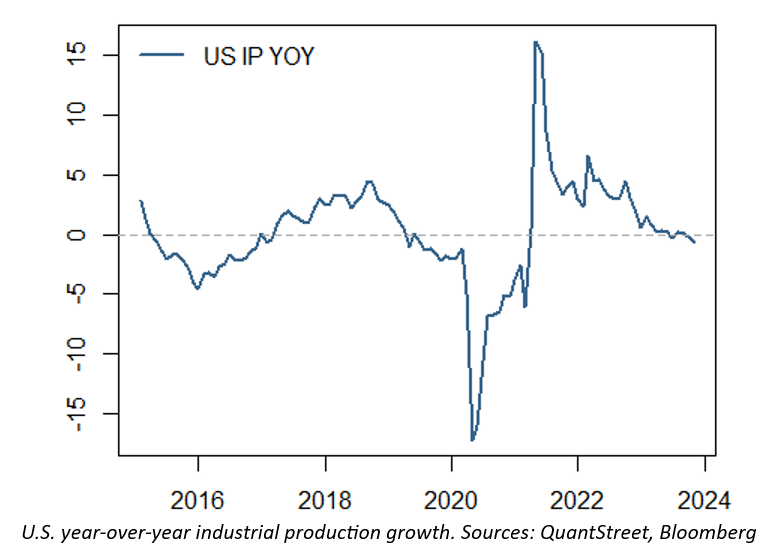
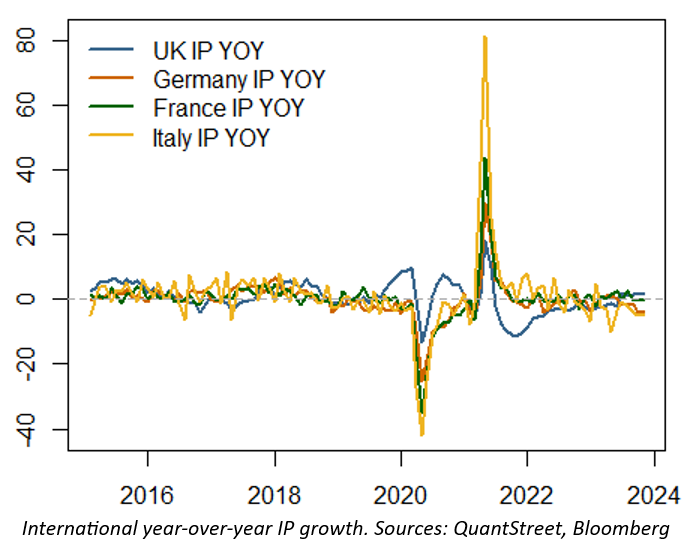
Year-over-year growth in industrial production – which, unlike the quarterly GDP data, is available monthly – is also slowing. The two most recent prints showed negative year-over-year growth. While not near the levels of the global financial crisis of 2008-2009 or the even sharper fall at the onset of the COVID pandemic in 2020, the currently negative year-over-year growth in industrial production is indicative of slowing economic growth, likely brought about by tight credit conditions on the back of Fed tightening.
Industrial production in Germany and France have similarly turned negative. Industrial production in Italy is weaker still. Only in the U.K. are there signs of a pickup in economic growth. But outside of this data point, the weakening growth story in the U.S. is mirrored by the experiences of the large European countries.
Jobs
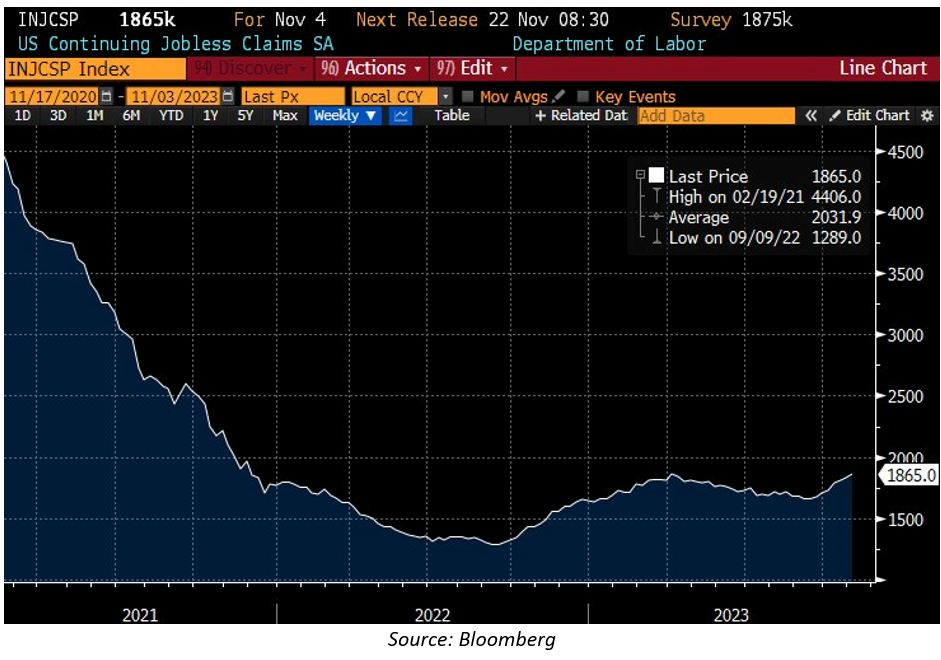
After their extreme spike during the economic shutdown of COVID-19 in 2020, continuing jobless claims in the U.S. trended down, reaching a nadir in 2022. Since that time, continuing claims have gone up, with the increase accelerating starting in September of 2023. Alongside the recently increasing U.S. unemployment rate, this increase in jobless claims is indicative of a weakening job market.
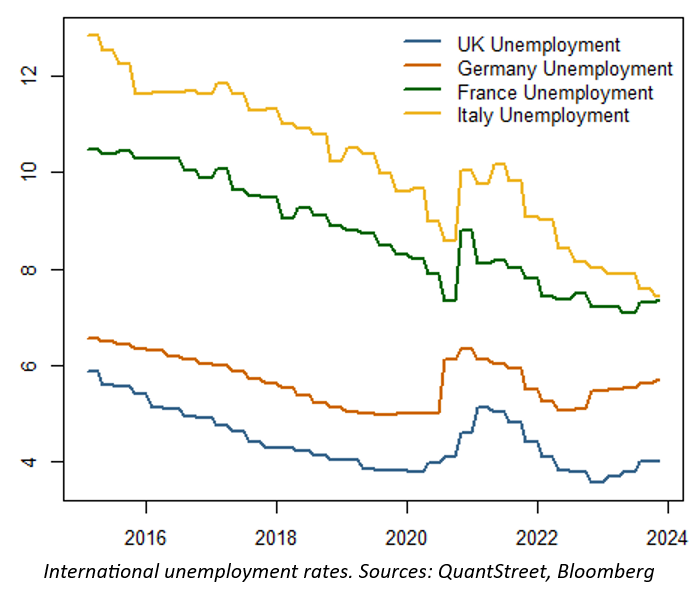
The story is similar when looking at international unemployment data. While the overall eurozone unemployment rate is at its cyclical lows, the unemployment rates of the U.K., Germany, and France have started to increase. Admittedly these increases are just blips from a low base, but if the trend persists into the next several quarters, the employment situation in Europe will meaningfully deteriorate.
COVID stimulus and the U.S. consumer
Estimates suggest that the U.S. government spent close to $5 trillion to stimulate the U.S. economy during the depths of the COVID crisis. Close to $2 trillion of the stimulus came in the form of checks and unemployment benefits to U.S. households. Despite this, as the COVID shock worked its way through the economy, consumers cut back on spending and engaged in precautionary savings to guard against potential future economic and geopolitical disruptions.
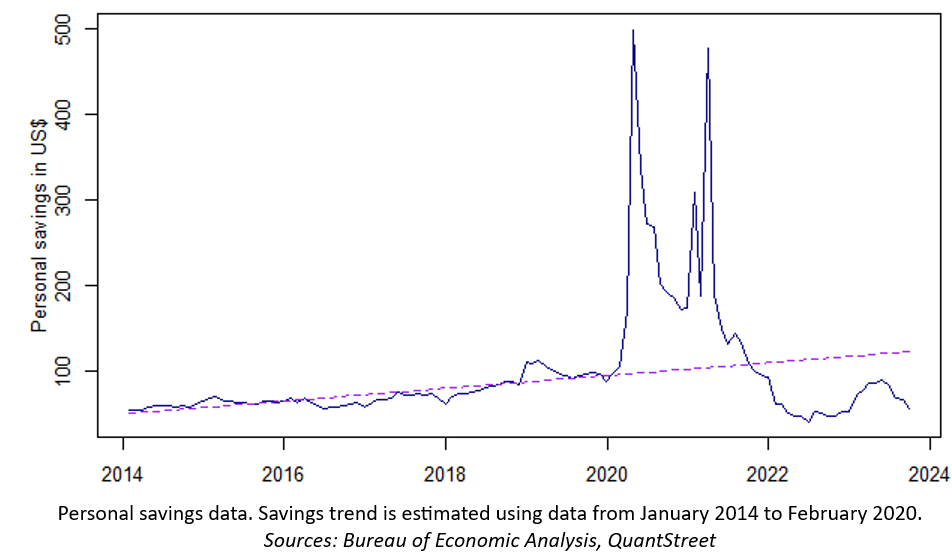
The next chart shows the monthly personal savings (in billions of dollars) of all U.S. households. The dashed line is the personal savings trend estimated using data from January 2014 to February 2020. From 2020 to just before 2022, savings ran far above trend as U.S. consumers, in aggregate, held back on spending. But starting in 2022, pent-up consumer demand for things like eating out and travel came roaring back and U.S. households started to spend the excess savings accumulated over the prior two years. One of the contributors to the 2022 inflation spike was this pent-up consumer demand.
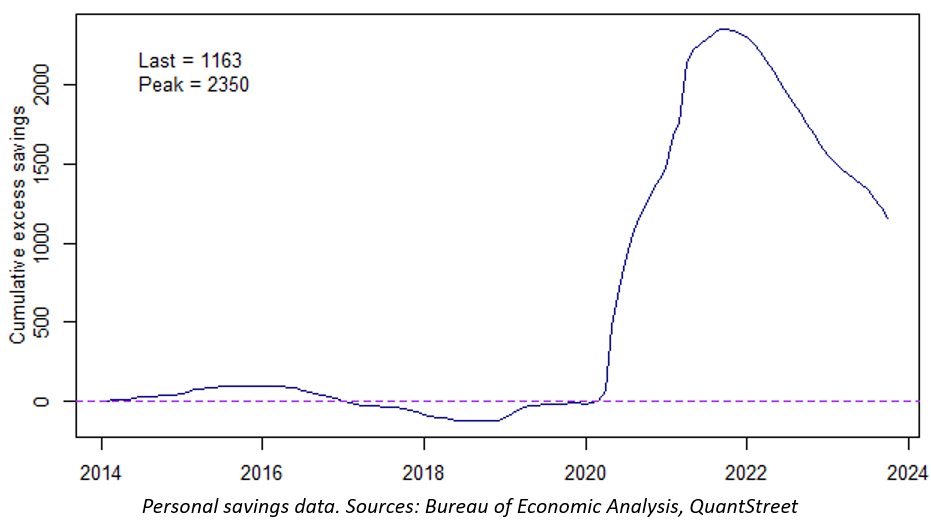
Next, consider excess savings – the cumulative sum of savings' deviation from trend – over the last decade. Based on my firm's (QuantStreet) savings trend estimate, cumulative excess savings peaked by late-2021 at $2.35 trillion. Since then, excess savings has fallen by roughly half, as consumers began to spend down their accumulated cash hoard. By late-2023, excess savings fell to $1.16 trillion. This is still a large amount of above-trend savings, but the trend is pointing to a depletion of excess savings, which will have far-reaching economic consequences.
Projecting this trend for another year or two will leave the U.S. consumer in a much weaker place. This will lead to lower spending and weaker economic growth, as well as more people entering the workforce and thus lower wage pressures. A different calibration of the trend by the San Francisco Fed yields an even lower estimate of current excess savings. In this case, the lower spending, weaker growth, and a re-entry into the work force may materialize even more quickly.
Taking stock
Inflation is slowing in the U.S. and internationally. At the same time, there is ample evidence of a global growth slowdown, as seen in employment and industrial production data. In the U.S., consumer sentiment is poor and home affordability is at historic lows. Furthermore, the large excess savings built up by the U.S. consumer in the wake of the COVID-19 crisis, is being slowly spent down, which will leave consumers with a smaller financial cushion should future macroeconomic issues arise.
While a growth slowdown is certainly underway, most measures of economic activity (outside of housing affordability and consumer sentiment) are not at historically extreme levels. Slowing inflation with moderately slower economic growth sets up well for the stock market, as the discount rate effect from lower rates is likely to dominate the weaker earnings effect of a mild recession. Stocks may thus be poised to do well in the ensuing 6-12 months. I have shown in the past that stocks tend to do well in the two-year period prior to and after the start of the easing cycle. Should the Fed start to ease in mid-2024, as the Fed funds futures market is forecasting, stocks are currently sitting in the sweet spot of the cycle.
While a reasonable base case, this benign forecast can be derailed by either a spike in inflation or a harsher-than-expected economic slowdown associated with much weaker corporate earnings. Despite my view that risk assets are set up for a rally into 2024, risks abound. Investors should tailor portfolios to their own risk tolerance and liquidity needs.
This article was originally published by Advisor Perspectives.